North
American Maharishi Vedic Vibration Technology Research Report
David
Scharf, Ph.D.
September
13, 1999
Abstract
These facts summarize the overall success of
the Maharishi Vedic Vibration Technology program: For all disorders, 1495 numerical reports were filed following
the third session. The average percent
improvement was 42.3%. This was
for chronic disorders with an average duration of 13.8 years. As a result of consultations lasting only 4
-5 days, participants reported significant improvement (here defined as 25% or
greater) in two thirds of the cases (991 out of 1495) and 100%
relief in 83 instances!
These are the most important charts:
Chart 1. Average Percent Improvement by Session
This shows the cumulative improvement from
first to second to third session.
Chart 2. Totals for All Disorders
This is a pie chart showing that two thirds
reported improvement of 25% or more.
Table 2. Categories of Disorders Sorted
According to Number of Participants Reporting
This shows which disorders were requested and
reported on most commonly. Seven of the
most common disorders (Musculoskeletal, Mental and Gastrointestinal disorders,
Pain as the primary problem, Respiratory problems and Cardiovascular and Gynecological
disorders) account for more than 70% of the disorders addressed. In addition to being among the most
requested disorders, these seven are among the disorders showing the greatest
improvement, with a combined average percent improvement of 45.55%.
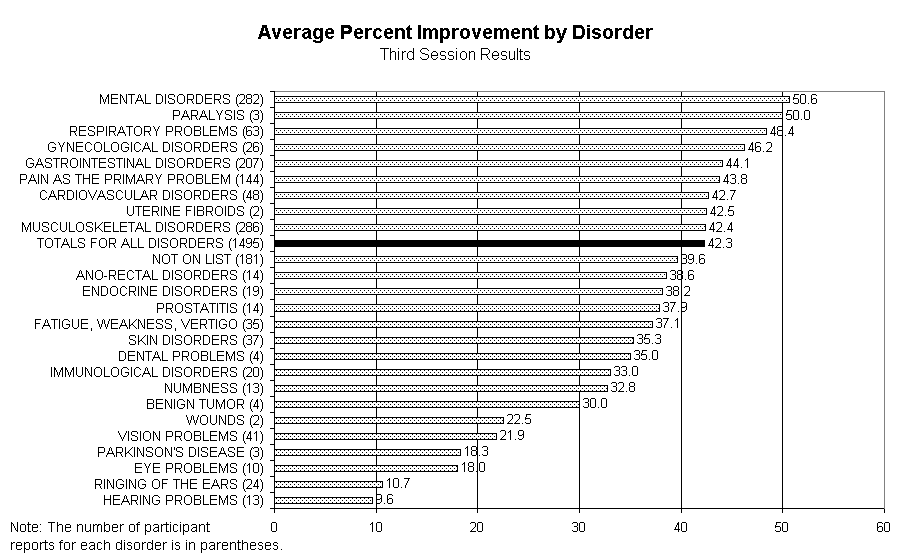
Chart 3. Average Percent Improvement by
Disorder
This may be the single most important chart in
this report, and so I provide a full-page version on the following page. It lists the categories of disorders from
least to most successful.
Section
1: Introduction
During the
first six months of the project six teams of Maharishi Vedic Vibration
Technology (MVVT) Experts travelled to 25 locations for more than 2000
consultations. Although a thorough
analysis of our research data will take many months to complete, I thought it
would be useful to provide a "sneak preview" of the data we have
collected so far.
A typical
consultation consists of three sessions over a four or five day period. Each session addresses an average of two
disorders. Approximately two-thirds of
the participants filled out evaluation forms after their sessions, and so far
we have entered 7,931 reports. While
only half of these reports have the "Percent Improvement" field
filled in, many people who did not provide a numerical rating reported
significant results in their comments.
Others indicated that, after just four or five days, it was too soon for
them to evaluate their progress.
Chart 1, below,
follows the progress of the 619 participants who filed numerical reports after
all three sessions. It shows that
the results are cumulative--the average percent improvement increased from
the first session to the second, and again from the second to the third session.
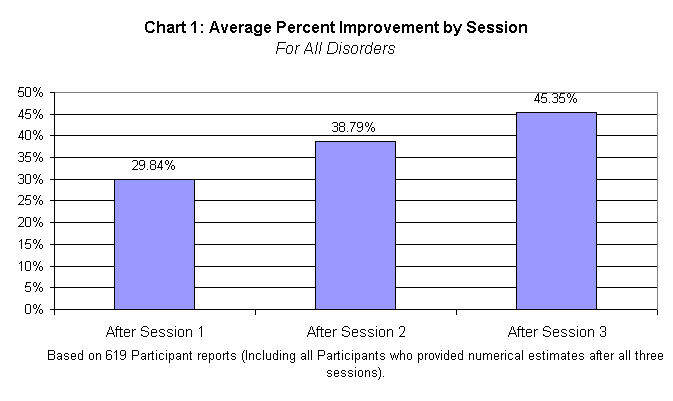 Chart 1. Average Percent Improvement by Session.
We are in
the process of gathering and analyzing longterm follow-up data. Although we do not yet have statistical
results, anecdotal reports suggest that, for many participants, their
conditions continue to improve in the weeks and months following their
consultations.
Participants
filed 1,495 numerical ratings after their third session. For these reports, the average improvement
was 42.3 percent. This is a remarkable
level of relief, since it was from chronic disorders with an average duration
of 13.8 years and was gained within a four-to-five day period. In two-thirds of the cases (989 out of
1495), these participants reported a 25-100 percent improvement. In 83 instances, 100% relief was
reported!
Table 1 and
Chart 2, below, show the quartile totals for all disorders.
|
Relief from Symptoms |
Number of
Reports |
Percent of Total |
|
75 - 100% improved |
362 |
24% |
|
50 - 74% improved |
335 |
22% |
|
25 - 49% improved |
292 |
20% |
|
Less than 25% |
506 |
34% |
|
Total Number of Reports |
1495 |
|
Table 1.
Quartile Results for All Disorders following Third Session
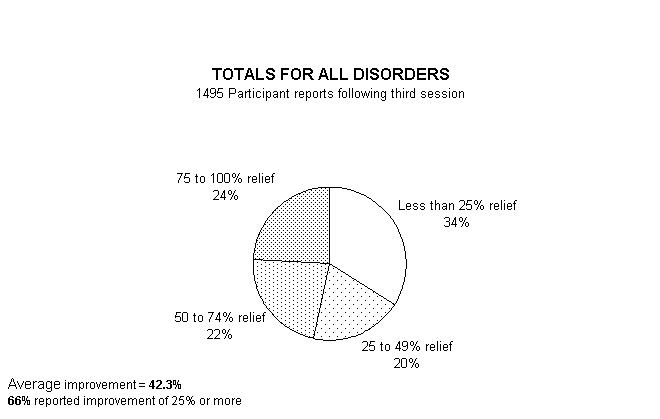 Chart 2. Totals for All Disorders
Section
2: Summary of Results by Category
The MVVT
program provided consultations for the 24 categories of disorders listed in
Table 2, below, as well as for disorders "Not On List." Table 2 describes the prevalence of numerical
reports for the various disorders and provides an indication of which disorders
were requested most. The various
categories of disorders are sorted according to the number of participants who
filled in the "Percent Improvement" field. Table 2 lists the Disorder Categories, the Number of Participants
and the Percentage of Total. The Number
of Participants field gives the number of participants who provided a numerical
estimate of their percent improvement.
The Percentage of Total field compares the Number of Participants to the
Total for all disorders.
|
Disorder Categories |
Number of Participants |
Percentage of Total |
|
MUSCULOSKELETAL
DISORDERS |
286 |
19.13% |
|
MENTAL
DISORDERS |
282 |
18.86% |
|
GASTROINTESTINAL
DISORDERS |
207 |
13.85% |
|
NOT ON LIST |
181 |
12.11% |
|
PAIN AS THE
PRIMARY PROBLEM |
144 |
9.63% |
|
RESPIRATORY
PROBLEMS |
63 |
4.21% |
|
CARDIOVASCULAR
DISORDERS |
48 |
3.21% |
|
VISION
PROBLEMS |
41 |
2.74% |
|
SKIN DISORDERS |
37 |
2.47% |
|
OTHER PROBLEMS
(Weakness, Fatigue, Vertigo) |
35 |
2.34% |
|
GYNECOLOGICAL
DISORDERS |
26 |
1.74% |
|
RINGING OF THE
EARS |
24 |
1.61% |
|
IMMUNOLOGICAL
DISORDERS |
20 |
1.34% |
|
ENDOCRINE
DISORDERS |
19 |
1.27% |
|
ANO-RECTAL
DISORDERS |
14 |
0.94% |
|
PROSTATITIS |
14 |
0.94% |
|
NUMBNESS |
13 |
0.87% |
|
HEARING
PROBLEMS |
13 |
0.87% |
|
EYE PROBLEMS |
10 |
0.67% |
|
BENIGN TUMOR |
4 |
0.27% |
|
DENTAL RELATED |
4 |
0.27% |
|
PARALYSIS |
3 |
0.20% |
|
PARKINSON'S
DISEASE |
3 |
0.20% |
|
UTERINE
FIBROIDS |
2 |
0.13% |
|
WOUNDS |
2 |
0.13% |
|
TOTAL FOR
ALL DISORDERS |
1495 |
|
Table 2.
Categories of Disorders Sorted According to Number of Participants Reporting
Table 3 and
Chart 3 compare the disorder categories in terms of their success. Table 3 shows the distribution of reports
between the four quartiles (75 to 100% improved, 50 to 74 % improved, 25 to 49%
improved and less than 25% ), the Total Number of Reports for each category of
disorders and the Average Percent Improvement for each disorder.
|
Disorder
Category |
75 to 100% improved |
50 to 74% improved |
25 to 49% improved |
Less than 25% |
Total Number of Reports |
Average Percent Improve-ment |
|
MENTAL
DISORDERS |
100 |
60 |
49 |
73 |
282 |
50.61 |
|
PARALYSIS |
1 |
1 |
1 |
0 |
3 |
50.00 |
|
RESPIRATORY
PROBLEMS |
20 |
18 |
7 |
18 |
63 |
48.38 |
|
GYNECOLOGICAL
DISORDERS |
8 |
6 |
5 |
7 |
26 |
46.19 |
|
GASTROINTESTINAL
DISORDERS |
49 |
56 |
35 |
67 |
207 |
44.08 |
|
PAIN AS THE
PRIMARY PROBLEM |
39 |
29 |
25 |
51 |
144 |
43.78 |
|
CARDIOVASCULAR
DISORDERS |
11 |
10 |
11 |
16 |
48 |
42.67 |
|
UTERINE
FIBROIDS |
1 |
0 |
0 |
1 |
2 |
42.50 |
|
MUSCULOSKELETAL
DISORDERS |
60 |
74 |
72 |
80 |
286 |
42.39 |
|
TOTALS FOR
ALL DISORDERS |
362 |
335 |
292 |
506 |
1495 |
42.30 |
|
NOT ON LIST |
39 |
42 |
42 |
58 |
181 |
39.61 |
|
ANO-RECTAL
DISORDERS |
3 |
2 |
4 |
5 |
14 |
38.57 |
|
ENDOCRINE
DISORDERS |
4 |
2 |
6 |
7 |
19 |
38.16 |
|
PROSTATITIS |
2 |
4 |
3 |
5 |
14 |
37.86 |
|
OTHER PROBLEMS
(Fatigue, …) |
8 |
3 |
10 |
14 |
35 |
37.14 |
|
SKIN DISORDERS |
6 |
12 |
2 |
17 |
37 |
35.27 |
|
DENTAL RELATED |
1 |
1 |
0 |
2 |
4 |
35.00 |
|
IMMUNOLOGICAL
DISORDERS |
4 |
4 |
1 |
11 |
20 |
33.00 |
|
NUMBNESS |
2 |
1 |
5 |
5 |
13 |
32.77 |
|
BENIGN TUMOR |
1 |
0 |
0 |
3 |
4 |
30.00 |
|
WOUNDS |
0 |
0 |
1 |
1 |
2 |
22.50 |
|
VISION
PROBLEMS |
2 |
5 |
7 |
27 |
41 |
21.85 |
|
PARKINSON'S
DISEASE |
0 |
0 |
1 |
2 |
3 |
18.33 |
|
EYE PROBLEMS |
0 |
2 |
2 |
6 |
10 |
18.00 |
|
RINGING OF THE
EARS |
1 |
2 |
2 |
19 |
24 |
10.67 |
|
HEARING
PROBLEMS |
0 |
1 |
1 |
11 |
13 |
9.62 |
Table
3. Disorder Categories Listed in terms
of Success
Chart 3,
below, lists the disorder categories in terms of their average percent
improvement. The number of reports that
each average is based on is given in parentheses after the disorder name.
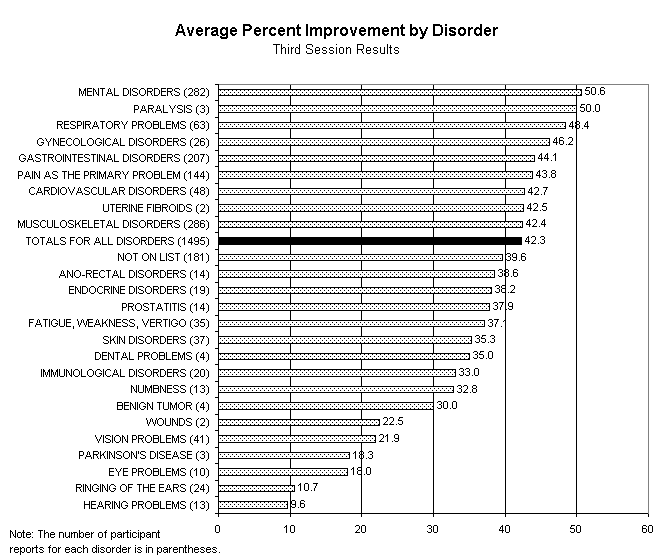
Chart 3.
Average Percent Improvement by Disorder
Section
3: Category Details
In this
section we will examine the disorders in more detail. Seven of the most prevalent categories which are also among the
most responsive to the MVVT program include Musculoskeletal, Mental and
Gastrointestinal disorders, Pain as the primary problem, Respiratory problems
and Cardiovascular and Gynecological disorders. These account for more than 70% of the disorders addressed, with
a combined average percent improvement of 45.55%
Musculoskeletal
Disorders
The average
percent improvement for all nine musculoskeletal disorders is 42.39%. Table 4, below, lists the disorders in order
of prevalence and shows the distribution of participant reports across the four
percent improvement quartiles. Chart 4
shows the average percent improvement for each disorder.
|
Disorder |
75 to 100% improved |
50 to 74% improved |
25 to 49% improved |
Less than 25% |
Total |
|
Back pain |
29 |
28 |
30 |
27 |
114 |
|
Osteoarthritis |
13 |
24 |
21 |
22 |
80 |
|
Rheumatoid
Arthritis |
6 |
7 |
7 |
11 |
31 |
|
Disk-related
problems |
1 |
9 |
7 |
12 |
29 |
|
Sciatica |
7 |
2 |
3 |
2 |
14 |
|
Frozen
shoulder |
3 |
2 |
2 |
2 |
9 |
|
Stress
Fracture |
0 |
1 |
1 |
2 |
4 |
|
Heel spurs |
0 |
1 |
1 |
1 |
3 |
|
Spondylitis of
the neck |
1 |
0 |
0 |
1 |
2 |
|
Totals |
60 |
74 |
72 |
80 |
286 |
Table 4.
Musculoskeletal Disorders listed in order of prevalence
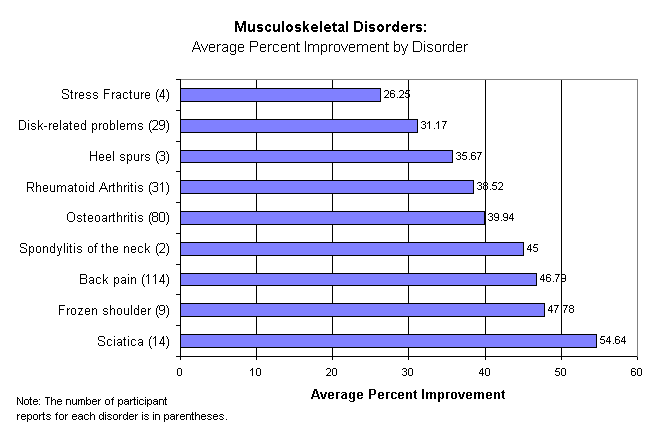 Chart 4. Musculoskeletal Disorders: Average Percent Improvement by Disorder
Mental
Disorders
The average
percent improvement for all eight mental disorders is 50.61%. Table 5, below, lists the disorders in order
of prevalence and shows the distribution of participant reports across the four
percent improvement quartiles. Chart 5
shows the average percent improvement for each disorder. The results for Grief, Emotional Instability,
Anxiety, Depression and Anger are quite striking.
|
Disorder |
75 to 100% improved |
50 to 74% improved |
25 to 49% improved |
Less than 25% |
Total |
|
Anxiety |
41 |
23 |
17 |
17 |
98 |
|
Insomnia |
12 |
10 |
14 |
33 |
69 |
|
Depression |
21 |
10 |
8 |
9 |
48 |
|
Anger |
12 |
8 |
3 |
7 |
30 |
|
Grief |
6 |
5 |
1 |
1 |
13 |
|
Emotional
Instability |
6 |
1 |
2 |
2 |
11 |
|
Forgetfulness |
1 |
3 |
2 |
3 |
9 |
|
Phobia |
1 |
0 |
2 |
1 |
4 |
|
Totals |
100 |
60 |
49 |
73 |
282 |
Table 5.
Mental Disorders listed in order of prevalence
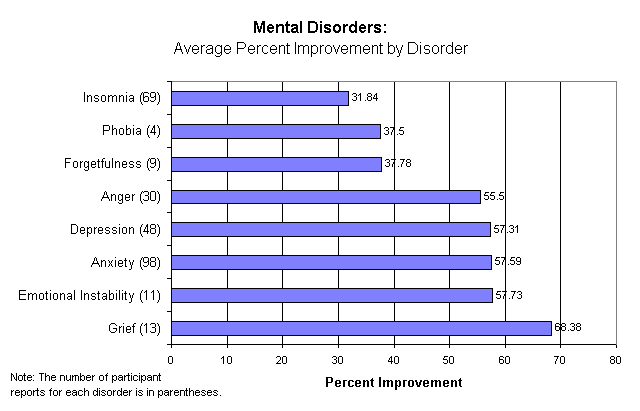 Chart 5. Mental Disorders: Average
Percent Improvement by Disorder
Chart 5. Mental Disorders: Average
Percent Improvement by Disorder
Gastrointestinal
Disorders
We have no
numerical reports for Anorexia, Dysentery, Gastric or Duodenal ulcer, Heartburn,
Liver enlargement or Hepatitis. For the
remaining seven Gastrointestinal Disorders, the average percent improvement is
44.08%. Table 6, below lists the
disorders in order of prevalence and shows the distribution of participant
reports across the four percent improvement quartiles.
|
Disorder |
75 to 100% improved |
50 to 74% improved |
25 to 49% improved |
Less than 25% |
Total |
|
|||
|
Digestive
problems |
36 |
45 |
25 |
51 |
157 |
|||||
|
Irritable bowel syndrome |
4 |
5 |
3 |
8 |
20 |
|||||
|
Constipation |
5 |
1 |
4 |
5 |
15 |
|||||
|
Gastritis |
0 |
1 |
2 |
3 |
6 |
|||||
|
Colitis |
2 |
2 |
0 |
0 |
4 |
|||||
|
Hyperacidity |
1 |
2 |
1 |
0 |
4 |
|||||
|
Anemia |
1 |
0 |
0 |
0 |
1 |
|||||
|
Totals |
49 |
56 |
35 |
67 |
207 |
|||||
Table 6.
Gastrointestinal Disorders listed in order of prevalence
Chart 6,
below, shows the average percent improvement for each disorder.
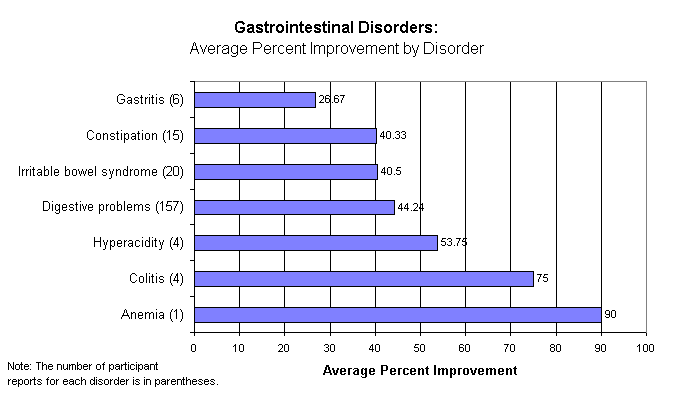 Chart 6. Gastrointestinal Disorders: Average Percent Improvement by Disorder
Pain as
the Primary Problem
We do not
have numerical reports for Pain following herpes zoster or Pain from
cancer. For the remaining six
disorders, the average percent improvement is 43.78%. Table 7, below lists the disorders in order of prevalence and
shows the distribution of participant reports across the four percent
improvement quartiles. Chart 7 shows
the average percent improvement for each disorder.
|
Disorder |
75 to 100% improved |
50 to 74% improved |
25 to 49% improved |
Less than 25% |
Total |
|
Pain syndrome |
29 |
19 |
19 |
35 |
102 |
|
Tension headache |
4 |
2 |
2 |
1 |
9 |
|
Migraine
headache |
3 |
2 |
1 |
4 |
10 |
|
Other headache |
3 |
3 |
1 |
6 |
13 |
|
Neuralgia |
0 |
2 |
1 |
3 |
6 |
|
Carpal tunnel syndrome |
0 |
1 |
1 |
2 |
4 |
|
Totals |
39 |
29 |
25 |
51 |
144 |
|
Table 7.
Disorders of Pain as the Primary Problem listed in order of prevalence
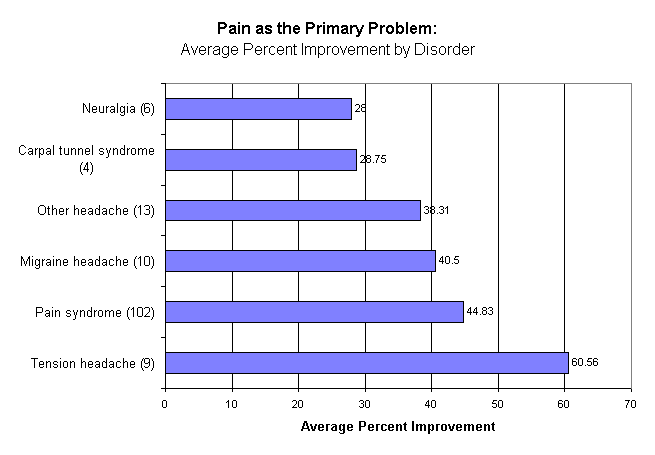
Chart 7.
Pain as the Primary Problem: Average Percent Improvement by Disorder
Respiratory
Problems
For the
three disorders in this group, the average percent improvement is 48.38%. Table 8, below, lists the disorders in order
of prevalence and shows the distribution of participant reports across the four
percent improvement quartiles. Chart 8
shows the average percent improvement for each disorder.
|
Disorder |
75 to 100% improved |
50 to 74% improved |
25 to 49% improved |
Less than 25% |
Total |
|
|||||
|
Asthma |
9 |
9 |
6 |
6 |
30 |
||||||
|
Bronchitis |
3 |
1 |
0 |
2 |
6 |
||||||
|
Sinusitis |
8 |
8 |
1 |
10 |
27 |
||||||
|
Totals |
20 |
18 |
7 |
18 |
63 |
||||||
Table 8.
Respiratory Problems listed in order of prevalence
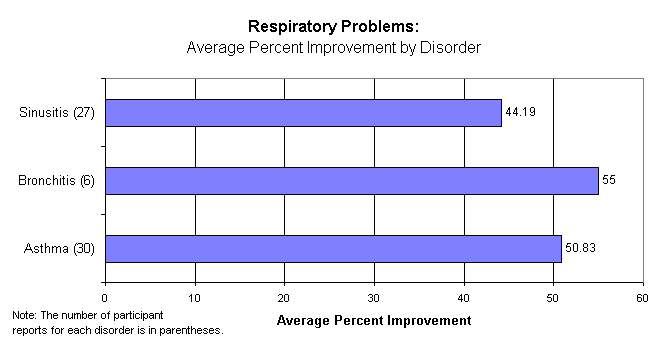 Chart 8. Respiratory Problems: Average Percent Improvement by Disorder
Cardiovascular
Problems
For these
four disorders, the average percent improvement is 42.67%. Table 9, below lists the disorders in order
of prevalence and shows the distribution of participant reports across the four
percent improvement quartiles. Chart 9
shows the average percent improvement for each disorder.
|
Disorder |
75 to 100% improved |
50 to 74% improved |
25 to 49% improved |
Less than 25% |
Total |
|
Hypertension |
3 |
5 |
4 |
6 |
18 |
|
Peripheral
vascular disease |
2 |
2 |
2 |
10 |
16 |
|
Ectopic heart
beat (palpitations) |
5 |
3 |
5 |
0 |
13 |
|
Stable angina |
1 |
0 |
0 |
0 |
1 |
|
Totals |
11 |
10 |
11 |
16 |
48 |
Table 9.
Cardiovascular Disorders listed in order of prevalence
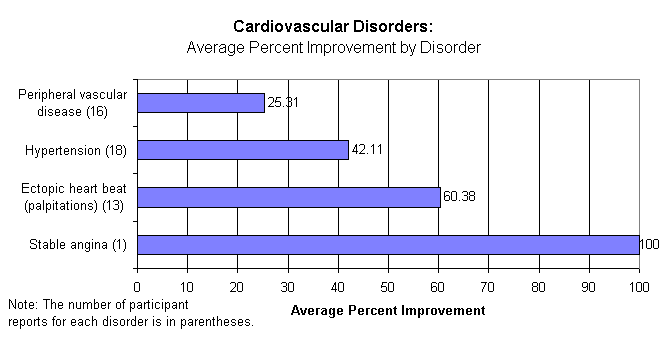 Chart 9. Cardiovascular Disorders: Average Percent Improvement by Disorder
The
dramatic improvement for Stable Angina is based on only one participant who
filed a numerical report after his third session, but it deserves consideration
nonetheless. This participant is a 47
year old man who had angina for 9 years and indicated that "in 1990 the
hospital thought I had tissue damage."
He complained of "pain in heart from lower front to the back,
numbness in left side, hand leg and face, weakness, dizziness, shortness of
breath" and he listed his condition as severe and disabling,
and the frequency of occurrence as daily.
After his first
session he reported 70% improvement and wrote, " The pain and pressure I felt
before the sessions is now relieved. I have such a feeling of
lightness." After his second
session he reported 85% improvement and wrote, " I feel a release of pain
and discomfort. I woke up with only about 30% pain I normally feel." After his third session he reported 100%
improvement and wrote, " Since yesterday's treatment no pain at all. This
morning I felt no pain or pressure. I have a lot more energy."
An 85 year old
woman also had a consultation for angina.
She did not indicate a numerical evaluation, but wrote simply, "What I don't understand
I accept as helping me. " Her
caregiver wrote:
Following
1st session she said she felt good, but not better or worse than when she went
in. However, after being out for 2 hrs she would usually have been very tired,
and she wasn't. She was bright in the evening also and slept well & awoke
with alertness. She got herself up without waiting for me to come home & encourage
her. She tolerated going out in a very blowy day with more appearance of
stamina too.
After her
second session, the woman indicated 100% improvement. (This was not picked up by my database query because the query
selected only third session results.)
She wrote that she was "pain free right now." She did not indicate a numerical result after her third session,
but wrote, "Have enjoyed the gracious good treatment, have received
relief, thank you all for taking good care of me."
These
results, coupled with the strong results for ectopic heart beat and
hypertension, suggest that the MVVT program may have a beneficial effect on
cardiovascular disease and that this possibility is worthy of further
study.
Gynecological
Disorders
For these
four disorders, the average percent improvement is 46.19%. Table 10, below lists the disorders in order
of prevalence and shows the distribution of participant reports across the four
percent improvement quartiles. Chart 10
shows the average percent improvement for each disorder.
|
Disorder |
75 to 100% improved |
50 to 74% improved |
25 to 49% improved |
Less than 25% |
Total |
|
Menopausal
difficulties |
3 |
4 |
3 |
4 |
14 |
|
Menstrual
disorders |
3 |
1 |
1 |
1 |
6 |
|
Premenstrual
syndrome |
1 |
1 |
0 |
2 |
4 |
|
Gynecological
problems |
1 |
0 |
1 |
0 |
2 |
|
Totals |
8 |
6 |
5 |
7 |
26 |
Table
10. Gynecological Disorders listed in order of prevalence
 Chart 10. Gynecological Disorders: Average Percent Improvement by Disorder
Ano-rectal
Disorders, Endocrine Disorders, Prostatitis, Other Problems (Weakness, Fatigue,
Vertigo), Skin Disorders, Dental Related, Immunological Disorders, Numbness,
Paralysis, Uterine Fibroids and Benign Tumor
For these
eleven categories of disorders, the number of participants ranged from 2
(Uterine Fibroids) to 37 (Skin Disorders).
The reported results ranged from 30% (Benign Tumor) to 50%
(Paralysis). These results are
described in Table 11 and Chart 11, below.
|
Disorder Category |
75 to 100% improved |
50 to 74% improved |
25 to 49% improved |
Less than 25% |
Total |
|||||
|
ANO-RECTAL
DISORDERS |
|
|
|
|
|
|
||||
|
Hemorrhoids |
3 |
2 |
3 |
5 |
13 |
|
||||
|
Anal fissure |
0 |
0 |
1 |
0 |
1 |
|
||||
|
SKIN DISORDERS |
|
|
|
|
|
|
||||
|
Psoriasis |
0 |
3 |
1 |
9 |
13 |
|
||||
|
Eczema |
4 |
5 |
0 |
3 |
12 |
|
||||
|
Atopic
dermatitis |
0 |
1 |
0 |
1 |
2 |
|
||||
|
Burning or
itching sensations |
2 |
3 |
1 |
4 |
10 |
|
||||
|
OTHER
DISORDERS |
|
|
|
|
|
|
||||
|
General
weakness |
3 |
1 |
4 |
4 |
12 |
|
||||
|
Chronic fatigue syndrome |
2 |
2 |
6 |
8 |
18 |
|
||||
|
Vertigo |
3 |
0 |
0 |
2 |
5 |
|
||||
|
NUMBNESS |
2 |
1 |
5 |
5 |
13 |
|
||||
|
PARALYSIS |
1 |
1 |
1 |
0 |
3 |
|
||||
|
UTERINE FIBROIDS |
1 |
0 |
0 |
1 |
2 |
|
||||
|
ENDOCRINE DISORDERS |
|
|
|
|
|
|
||||
|
Diabetes |
2 |
1 |
2 |
5 |
10 |
|
||||
|
Thyroid
problems |
1 |
0 |
2 |
2 |
5 |
|
||||
|
Adrenal gland
problems |
1 |
0 |
1 |
0 |
2 |
|
||||
|
Kidney
disorders |
0 |
1 |
1 |
0 |
2 |
|
||||
|
IMMUNOLOGICAL
DISORDERS |
|
|
|
|
|
|
||||
|
Allergies |
4 |
4 |
1 |
11 |
20 |
|
||||
|
PROSTATITIS |
2 |
4 |
3 |
5 |
14 |
|
||||
|
BENIGN TUMOR |
1 |
0 |
0 |
3 |
4 |
|
||||
|
DENTAL PAIN |
1 |
1 |
0 |
2 |
4 |
|
||||
Table
11. Assorted Disorder Categories with Varying Levels of Average Improvement
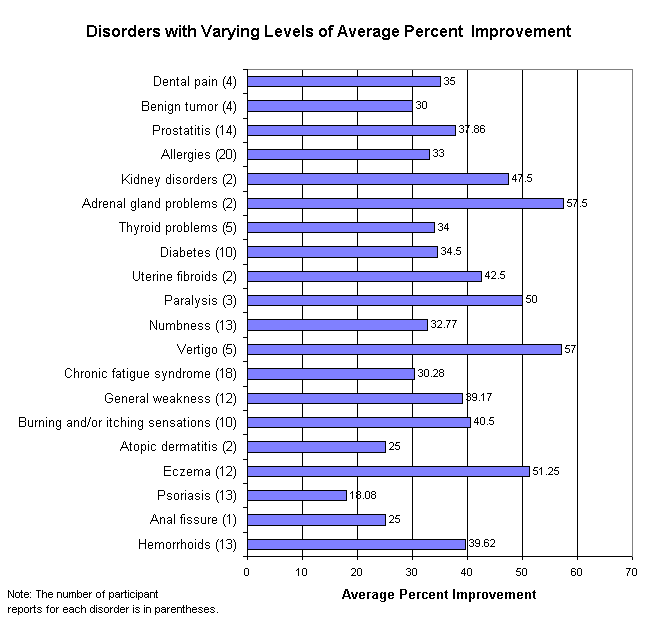 Chart 11. Disorders with Varying Levels of Average Improvement
Wounds, Vision
Problems, Parkinson's Disease, Eye Problems, Ringing of the Ears, Hearing
Problems
This group
of disorders was the least responsive to the MVVT program, at least in the
short term. Table 12 and Chart 12,
below, show the results.
|
Disorder Category |
75 to 100% improved |
50 to 74% improved |
25 to 49% improved |
Less than 25% |
Total |
|
|
|
Vision
problems |
2 |
5 |
7 |
27 |
41 |
||
|
Ringing of the
ears (tinnitis) |
1 |
2 |
2 |
19 |
24 |
||
|
Hearing
problems |
0 |
1 |
1 |
11 |
13 |
||
|
Eye problems |
0 |
2 |
2 |
6 |
10 |
||
|
Parkinson's
disease |
0 |
0 |
1 |
2 |
3 |
||
|
Wounds |
0 |
0 |
1 |
1 |
2 |
||
Table
12. Miscellaneous Disorder Categories with Lowest Levels of Average Improvement
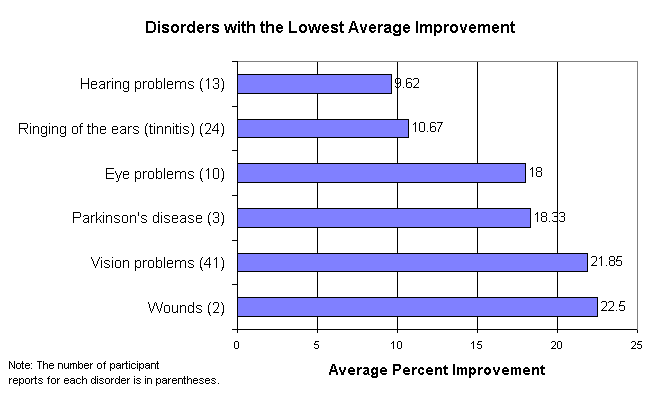 Chart 12. Disorders with Lowest Levels of Average Improvement
Section
4: Additional Observations
A few quick
queries of the database enable us to look at a number of parameters, including
duration, severity, degree of disability, frequency of occurrence, type of pain
and age and gender.
Duration
of the Disorder
I looked at
three intervals (less than 3 years duration, the open interval from 3 to 10
years and 10 years to 40 years). For
the Null fields, in which the participant didn't fill in the duration fields on
his or her application, the duration of the disorder is unknown. If we assume the Null fields indicate that
the disorder was of short duration, then the average percent improvement for
the shortest period would be 42.37%.
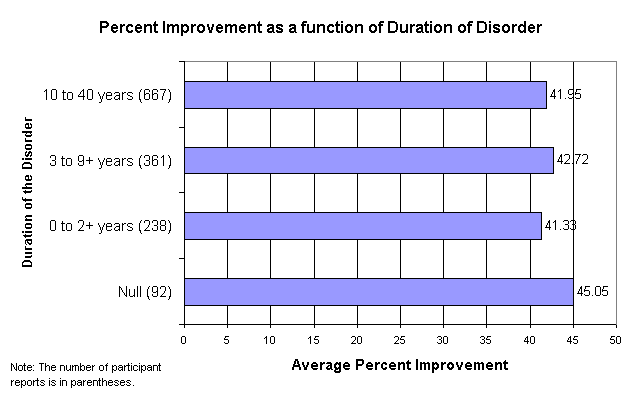 Chart 13. Percent Improvement as
a function of Duration of Disorder
Chart 13. Percent Improvement as
a function of Duration of Disorder
Disorder
Severity
For each
disorder, applicants indicated whether the severity of their disorder was Mild,
Moderate, Severe or Very Severe. Also,
many applicants left that field blank (which is recorded in our database as
Null). The results are shown in Chart
14, below. It is, perhaps, not
surprising that the Very Severe disorders should be the most resistant to
improvement.
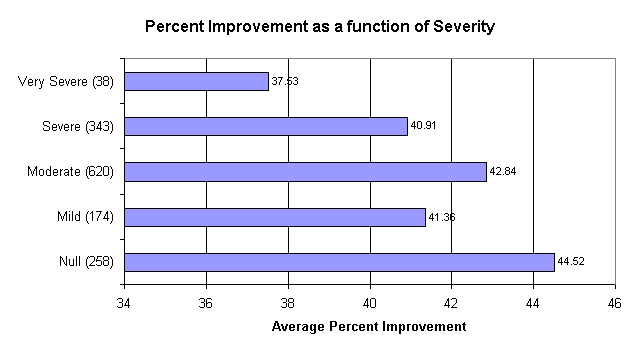 Chart 14. Percent Improvement as a function of Severity
Degree
of Disability
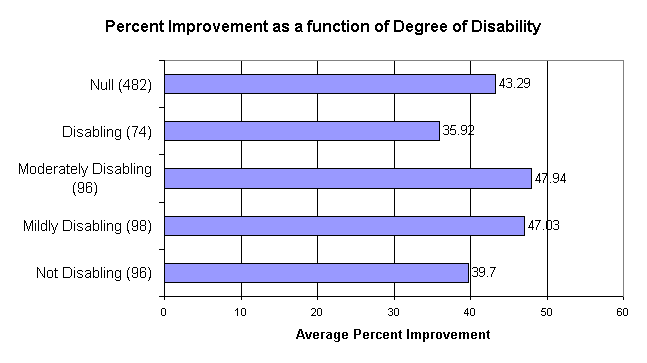 Chart 15. Percent Improvement as a function of Degree of Disability
Frequency
of Occurrence
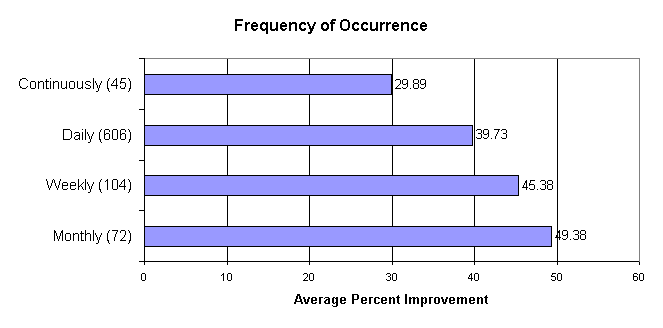 Chart 16. Frequency of Occurrence
Type of
Pain
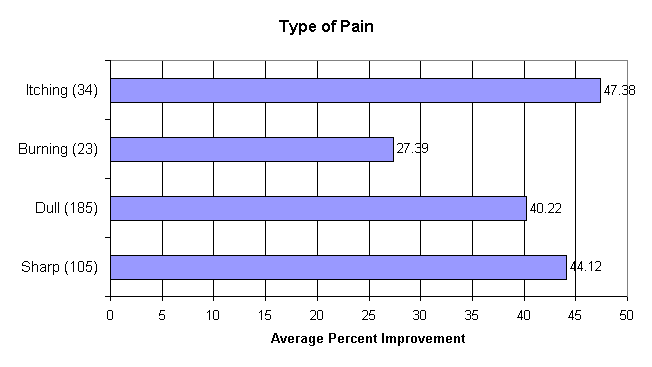 Chart 17. Type of Pain
Age and
Gender
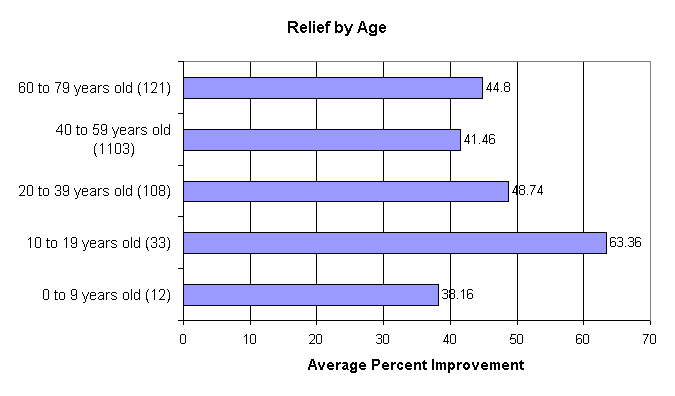 Chart 18. Relief by Age
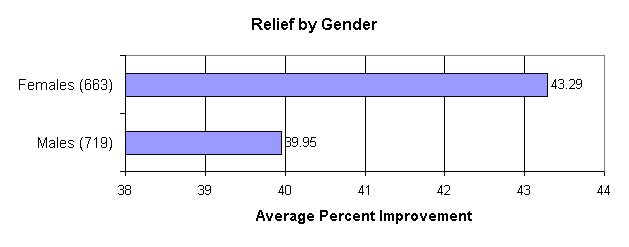 Chart 19. Relief by Gender
Chart 20,
on the following page, shows the average percent improvement for all the disorders
for which we have three or more participant reports.
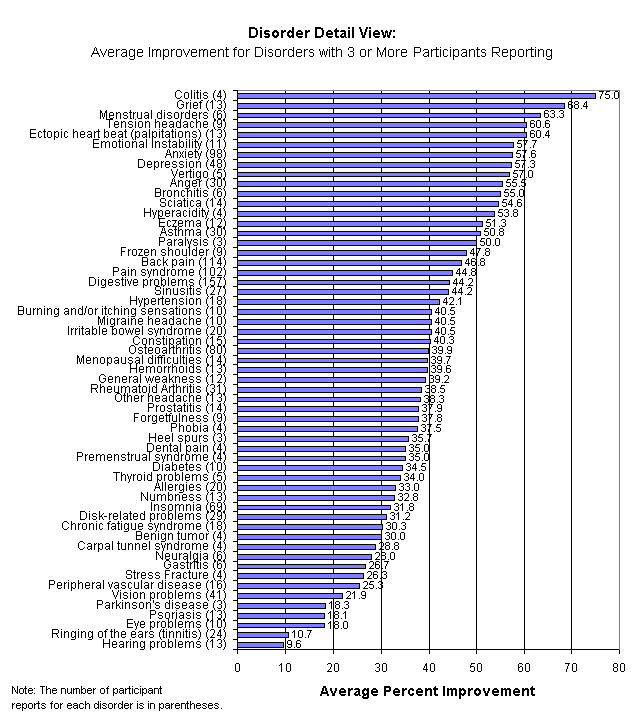 Chart 20. Disorder Detail View